Plus Two Economics Chapter 5 Market Equilibrium Question and Answers PDF Download: Students of Standard 12 can now download Plus Two Economics Chapter 5 Market Equilibrium question and answers pdf from the links provided below in this article. Plus Two Economics Chapter 5 Market Equilibrium Question and Answer pdf will help the students prepare thoroughly for the upcoming Plus Two Economics Chapter 5 Market Equilibrium exams.
Plus Two Economics Chapter 5 Market Equilibrium Question and Answers
Plus Two Economics Chapter 5 Market Equilibrium question and answers consists of questions asked in the previous exams along with the solutions for each question. To help them get a grasp of chapters, frequent practice is vital. Practising these questions and answers regularly will help the reading and writing skills of students. Moreover, they will get an idea on how to answer the questions during examinations. So, let them solve Plus Two Economics Chapter 5 Market Equilibrium questions and answers to help them secure good marks in class tests and exams.
|
Board |
Kerala Board |
|
Study Materials |
Question and Answers |
|
For Year |
2021 |
|
Class |
12 |
|
Subject |
Economics |
|
Chapters |
Economics Chapter 5 Market Equilibrium |
|
Format |
|
|
Provider |
How to check Plus Two Economics Chapter 5 Market Equilibrium Question and Answers?
- Visit our website - https://spandanamblog.com
- Click on the 'Plus Two Question and Answers'.
- Look for your 'Plus Two Economics Chapter 5 Market Equilibrium Question and Answers'.
- Now download or read the 'Class 12 Economics Chapter 5 Market Equilibrium Question and Answers'.
Plus Two Economics Chapter 5 Market Equilibrium Question and Answers PDF Download
We have provided below the question and answers of Plus Two Economics Chapter 5 Market Equilibrium study material which can be downloaded by you for free. These Plus Two Economics Chapter 5 Market Equilibrium Question and answers will contain important questions and answers and have been designed based on the latest Plus Two Economics Chapter 5 Market Equilibrium, books and syllabus. You can click on the links below to download the Plus Two Economics Chapter 5 Market Equilibrium Question and Answers PDF.
Question 1.
Complete the statement given below. Free entry and of firms imply that the market price will always be equal to ……………
Answer:
Minimum average cost (P = Min. AC)
Question 2.
Choose the correct answer. The imposition of price ceiling below the equilibrium price leads to ……….
Answer:
Excess demand
Question 3.
Market equilibrium of a commodity shows,
(a) excess demand
(b) quantity demanded greater than quantity supplied
(c) quantity demanded equals quantity supplied
(d) excess supply
Answer:
(c) quantity demanded equals quantity supplied
Question 4.
When there is increase in demand, the demand curve.
(a) shifts reight ward
(b) shifts leftward
(c) shifts downward
(d) remains constant
Answer:
(a) shifts reight ward
Question 5.
The government imposing upper limit on the price of a good or service is called:
(a) price floor
(b) price ceiling
(c) equilibrium price
(d) fair price
Answer:
(b) price ceiling
Plus Two Economics Market Equilibrium Two Mark Questions and Answers
Question 1.
At what price – higher or lower than the equilibrium price, there will be excess demand?
Answer:
When the market price is lower than the equilibrium price, there will be excess demand.
Question 2.
Make pairs.
Price floor, below equilibrium price, above equilibrium price, price ceiling
Answer:
- Price floor – above equilibrium price.
- Price ceiling – below equilibrium price.
Question 3.
Point out the consequences of price ceiling.
Answer:
- Black marketing
- Malpractices by fair price shops
- Sale of inferior quality goods.
Question 4.
What do you mean by control price?
Answer:
Fixation of price of a commodity at a lower level than equilibrium price is called control price. Control price is determined to protect the interest of the consumers.
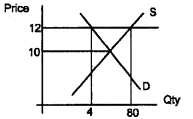
Question 5.
Market equilibrium of apple is given below in the diagram below.
- Define market equilibrium
- Find out the market price and equilibrium quantity

Answer:
- market equilibrium is a situation where quantity demanded is exactly equal to the quantity supplied.
- The price of apple is ₹40 and the equilibrium quantity is 30kg.
Plus Two Economics Market Equilibrium Three Mark Questions and Answers
Question 1.
Match the following.
| A | B |
| Price lower than equilibrium price | Excess demand |
| Equilibrium price | Excess supply |
| Price higher than equilibrium price | Demand = Supply |
Answer:
| A | B |
| Price lowerthan equilibrium price | Excess supply |
| Equilibrium price | Demand = Supply |
| Price higher than equilibrium price | Excess demand |
Question 2.
The demand function and supply function of a product are given as qD = 60 – P for 0 = P = 60 qS = 30 + P for P > 10 Calculate equilibrium price.
Answer:
The demand and supply functions are given as
qD= 60 – P for 0 = P = 60
qS = 30 + P for P > 10
Equilibrium price is considered as the price at which quantity demanded is exactly equal to quantity supplied. Therefore we get.
60 – P = 30 + P
60-30 = 2 P
30 = 2P
P = 30/2 = 15
Therefore equilibrium price is ₹15.
Question 3.
Complete the following statements.
- Long-run price under perfect competition will be equal to ……….
- Minimum price fixed by government for a product is known as ……….
- Maximum price fixed by government for a product is known as ………
Answer:
- average cost
- floor price
- price ceiling
Question 4.
Demand curve for labour is downward sloping. Explain
Answer:
Demand curve for labour is downward sloping indicating that more and more labour is demanded at lower wages. This is due to the operation of declining marginal productivity of labour. Marginal productivity of labodr declines due to the operation of diminishing returns. That is why the demand curve for labour slopes downward.
Question 5.
The market demand function and market supply functions are given as, Find the equilibrium price and equilibrium quantity.
qD = 200 – P for 0 = P = 200
qS = 120 + P for P > 10
Answer:
We find equilibrium price by equating market demand function and market supply functions as shown below.
qD = qS
200-P = 120 + P
2P = 80
P = 80/2 = 40
Therefore equilibrium price is ₹40. Equilibrium quantity is obtained by substituting the equilibrium price into either the demand or supply function equations. Applying the value of price ₹40 in demand equation we have.
qD= 200 – P
qD =200 – 40 = 160
Therefore equilibrium price is ₹40 and equilibrium quantity is 160.
Question 6.
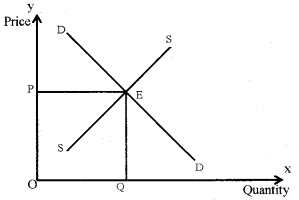
Prepare a note on market equilibrium.
Answer:
Equilibrium is defined as a situation where the plans of all consumers and firms in the market match and the market dears. In equilibrium, the aggregate quantity that all firms wish to sell equals the quantity that all the consumers in the market wish to buy; in other words, market supply equals market demand. The price at which equilibrium is reached is called equilibrium price and the quantity bought and sold at this price is called equilibrium quantity.
Therefore, qD (P*) = qS (P*) where P* denotes the equilibrium price and qD (P*) and qS (P*) denote the market demand and market supply of the commodity respectively at price P*
Question 7.
Suppose the demand and supply functions of commodity X are given by, Qd = 500 + 3P and Qs = 700 – P Qd = 500 + 3P Qs = 700 – P Find out the equilibrium price and quantity demanded and supplied.
Answer:
Equilibrium price and quantity can be determined by equating the demand and supply functions
Qd = Qs
500 + 3P = 700 – P
4P = 200
\(P=\frac{200}{4}=50\)
Equilibrium price is ₹50. Applying the price in the demand function, we get
500 + 3 × 50
500 + 150 =650
Therefore, equilibrium price is ₹50 and quantity is 650.
Qd = Qs
500 + 3P = 700 – P
4P = 200
\(P=\frac{200}{4}=50\)
Qd = 500 + 3 × 50
= 500 + 150 = 650
Question 8.
The diagram below illustrates the supply and demand for television sets. The original demand curve is D2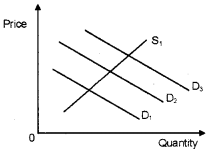
Using the diagram, state the new demand curve (D1 or D3) which will apply after each of the following changes taken place. (The same answer may be used more than once)
- A successful advertising campaign for television sets occurs
- Income decreases
- An increase in the population
Answer:
- Demand increases (D2 curve shifts right to D3)
- Demand decreases (D2 curve shifts left to D1)
- Demand increases (D1 curve shifts right to D3)
Question 9.
Calculate equilibrium price and quantity based on the following information.
qd= 400 – P (1)
qs= 240 + 3 (p – 4) (2)
Answer:
At equilibrium,
qd = qs
Putting the values,
400 – p = 240 + 3(p – 4)
400 – p = 240 + 3p – 12
400-240 + 12 = 3p + p
172 = 4p
\(p=\frac{172}{4}\)
p =43
Putting p = 43 in the first equation, we get,
qd =400 – 43 = 357 Therefore, equilibrium price = 43 and
equilibrium quantity is = 357 units
Question 10.
The diagram shows relationship between two commodities A and B.
- Identify the commodities A and B
- Explain what happens to the price and quantity demanded of A when the price of A falls.
Answer:
- A and B are substitutes.
- When the price of A falls people will demand more A. So the demand for B will fall. That will result in a decrease in the price of B.
Question 11.
The diagram below shows one of the government intervention programmes in the market.
- Identify the programme and calculate the excess supply.
- Explain how the government is monitoring the higher price fixed.
Answer:
1. Minimum price/floor price, 40 unit excess supply.
2. The government announces the minimum price above the market price. As a result of this intervention there occurs excess supply in the market. The government has to remove the excess from the market to maintain the price. So the government store the excess supply in the warehouses and redistribute it at the time of shortage.
Question 12.
Under perfect competition, a market for a good is in equilibrium. There is simultaneous “decrease” both in demand and supply, but there is no change in market price. Explain with the help of a diagram how it is possible.
Answer:
The decrease in demand and supply is the same, and hence the price remain the same. Shows this by drawing appropriate diagram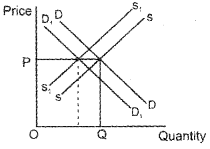
Question 13.
The diagrams below indicate four possible shifts in demand or in supply that could happen in particular markets. Relate each of the events described below to one of them. Also, give reason for the shift.
- How does the lorry strike in Karnataka and Tamil Nadu affect the market for vegetables in Kerala?
- People become aware of the fact that Birds Eye Chilly is very much helpful to prevent Cholesterol. What happens to the market for Birds Eye Chilly?
- How do you think the rising income affect the market for fish?
- A new technique is discovered for manufacturing computer that greatly lowers their production cost. What happens to the market for computers?
Answer:
- figure C, supply falls and price rises.
- figure A, demand increases and price rises.
- figure B, demand increases and price rises.
- figure D, supply increases and price falls.
Plus Two Economics Market Equilibrium Five Mark Questions and Answers
Question 1.
Mention the impact of the following.
- Imposition of price ceiling below equilibrium price
- Imposition of price floor above the equilibrium price
Answer:
- Imposition of price ceiling below equilibrium price leads to excess demand.
- Imposition of price floor above the equilibrium price leads to an excess supply
Question 2.
Complete the following table to show the impact of simultaneous shifts of demand and supply on equilibrium price and quantity.
Answer:
Question 3.
What will happen if the price prevailing in the market is?
- above the equilibrium price
- below the equilibrium price.
Answer:
1. If the price prevailing in the market is above equilibrium price, supply will exceed demand. Under such a situation some firms will not be able to sell their desired quantity; so they will lower their price. All other things remaining constant as price falls quantity demanded rises quantity supplied falls, and finally equilibrium price P* will be restored. At P* quantity demanded will be equal to quantity supplied.
2. If the price prevailing in the market is above equilibrium price, demand will exceed supply. Under such a situation some consumers will be ready to pay more prices to get the commodity. This will tend to increase the price. All other things remaining constant as price rises quantity demanded falls, quantity supplied rises, and finally, equilibrium price P* will be restored. At P* quantity demanded will be equal to quantity supplied.
Question 4.
Draw distinction between floor pricing and price ceiling.
Answer:
Floor price means minimum price. Floor price is fixed to protect producers like farmers from price crashes. It ensures a remunerative price to producers. In India, floor prices are fixed for a variety of agricultural commodities like paddy, wheat, coconut, rubber etc.
On the other hand, price ceiling mean maximum price. It is the maximum price fixed by the government. The aim of price ceiling is to protect consumers. Government fixes price ceiling for essential products and medicines to protect the interests of the consumers.
Question 5.
- Identify the situations depicted in the following figures in panel A and B.
- Why do such policies are followed and explain the impact of such policies?
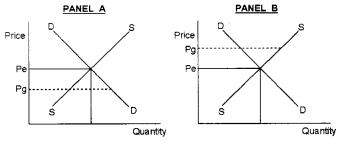
Answer:
1. PANEL A – Price ceiling PANEL B –Price floor.
2. Price ceiling is fixed below equilibrium price. Imposition of price ceiling at ‘Pg’ gives rise to excess demand in the market price floor is fixed above equilibrium price. Imposition of floor price at ‘pg’ gives rise to excess supply.
Question 6.
Mention the factors that cause shift in the supply curve.
Answer:
The factors that cause shift in the supply curves are:
- The change in the number of firms
- The change in the price of factor inputs
- Change in production technology
- Change in the prices of related goods
- Change in production tax.
Question 7.
How will a change in price of coffee affect the equilibrium price of tea? Explain the effect on equilibrium quantity through a diagram.
Answer:
Coffee and tea are substitutes. If prices of coffee are increased then its demand will decrease and demand tea would increase.lt will shift the demand curve of tea upwards. The equilibrium price and quantity will increase. This is shown in the following diagram.
In the diagram, when the price of coffee increased then the demand for tea increases. This has resulted in equilibrium price and quantity of tea.
Question 8.
How is price determined in labour market?
Answer:
The price of labour is determined by the forces of demand and supply of labour. The households are the suppliers of labour and demand for labour comes from firms. Labour means the hours of work provided by labourers. The wage rate is determined at the intersection of the demand and supply curve of labour.
The firm being a profit maximiser will always employ labour up to the point where the extra cost it incurs for the last labour is equal to the additional benefit he earns from employment that labour. The extra cost of hiring one more labour is the wage rate. For each extra unit of labour, he gets a benefit equal to marginal revenue product of labour.
Thus firm employs labour up to a point where: W = MRPL Where MRPL = MR x MPL As long as MRPL is greater than the wage rate the firm will earn more profit by hiring one more labour and if at any level of labour employment MRPL is less than the wage rate the firm can increase here profit by reducing labour employed.

Question 9.
Prepare a table showing differences between price ceiling and price floor.
Answer:
| Price ceiling | Price floor |
| Upper limit set by the government for some commodities | Lower limit set by the government for some commodities |
| Imposed on essential goods such as wheat, rice etc. | Agricultural goods, workers etc. are benefitted |
| To maintain price ceiling, fair price shops may be opened | To maintain price floor, government needs to buy the excess quantity supplied |
| Price lower than the equilibrium price | Price higher than the equilibrium price |
| Creation of excess demand | Creation of excess supply |
Question 10.
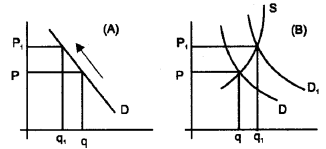
- With the help of a diagram show how the wage rate is determind in a free market.
- Analyse the impact of an increased entrance of foreign migrant labourers into the labour market.
Answer:
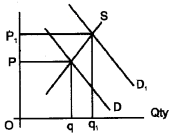
1. The diagram below shows how the wage rate of labour in a free market is determined. DL is the demand for labour and SL is the supply of labour, ‘e’ is the point of equilibrium, ‘ow’ is the wage rate and ‘oq’ is the quantity of labours.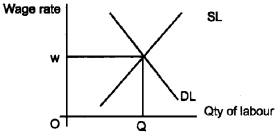
2. When the foreign migrant labour enters into the labour market, the supply of labour will shift rightward and the wage rate will come down as shown in the figure. ‘ow’ is the original wage rate and ‘OQ’ is the original quantity of labour. ow1 is the new wage rate and OQ, is the new quantity of labourers.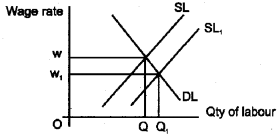
Question 11.
Suppose we have two equations, one for demand and other for supply.
Demand equation: Qxd = 100 – 10Px
Supply equation : Qxs = 60 + 10Px
- Calculate equilibrium price and quantity using the equations.
- Construct demand and supply schedules by assigning various prices. Obtain equilibrium price and quantity graphically.
Answer:
1. Equilibrium price =2, equilibrium quantity=80
2. Demand & supply schedules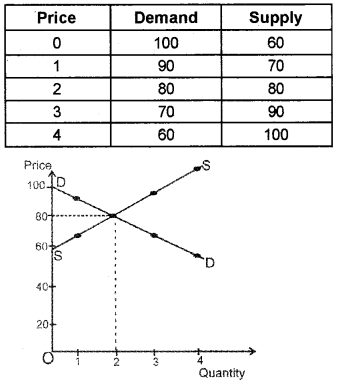
Question 12.
Let us take market of commodity ‘X’, which is in equilibrium. Suppose demand for the commodity increases. Explain the chain of effects of this change till the market again reaches equilibrium. Use diagram.
Answer:
Increase in demand leads to disequilibrium-price in-creases – super profit – new firms enter the industry – or existing firms expand production – increase in output – supply increases – supply curve shifts – the process continue until price returns the to the equilibrium level. Draws the diagram, and explains the process.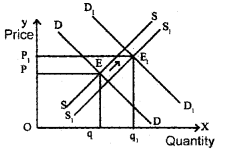
Plus Two Economics Market Equilibrium Eight Mark Questions and Answers
Question 1.
Observe the following table.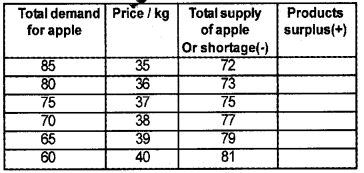
- Find equilibrium price.
- Fill the fourth column
- Why ₹35 and ₹40 are not equilibrium prices?
- Product surplus drives prices up and shortage drives them down. Do you agree?
- Draw a diagram of the above table showing the equilibrium price determination
Answer:
1. The equilibrium price is ₹37. At this price both demand and supply are equal.
2.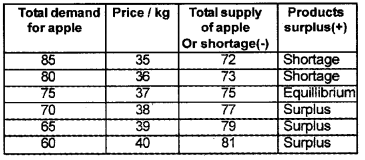
3. At ₹35, demand exceeds the supply causing a shortage in the market. At ₹40, supply exceeds demand causing surplus. Therefore, these prices are equilibrium prices.
4. No. I do not agree with this argument.
5.
Question 2.
Discuss the impact of the factors mentioned below on equilibrium price and quantity.
- shift in demand to right
- shift in demand to left
- shift in supply to right
- shift in supply to left.
Answer:
1. When demand curve shifts to right (increase in demand), there will be increase in equilibrium price and increase in equilibrium quantity. This change is shown in the diagram.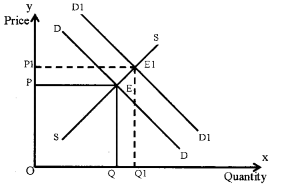
2. When demand curve shift to left (decrease in demand), both equilibrium quantity and equilibrium price falls. This is shown in the diagram.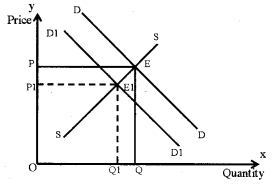
3. When supply curve shift to right (increase in supply), the equilibrium price deceases and the equilibrium quantity increases. This is given in the following diagram.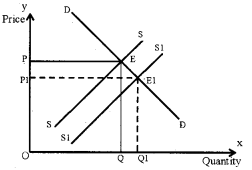
4. When supply curve shifts to left (decrease in supply), the equilibrium price increases and the equilibrium quantity decreases. This is given in the following diagram.
Question 3.
Suppose the demand and supply curves of salt are given by. qD = 1000 – P qS = 700 + 2P
- Find the equilibrium price and quantity
- Suppose that the price of input used to produce salt has increased so that the supply curve is qS = 400 + 2P How does the equilibrium price and quantity change? Does the change conform to your expectation?
- Suppose the government has imposed a tax of 3 per unit of salt. How does it affect the equilibrium price and quantity?
Answer:
1. equilibrium price and quantity
qD = 1000 – P
qS = 700 + 2P
For equilibrium
qD = qS
1000 – P = 700 + 2P
1000 – 700 = 3 P
3P = 300
P = 300/3 = 100
Put the value of P in supply equation
qS = 700 + 2P
qS = 700 + 2×100
qS =700 + 200 = 900
Therefore the equilibrium price = ? 100 and the equilibrium quantity is = 900 units
2. For equilibrium
qD = qS
1000 – P = 400 + 2P
1000 – 400 = 3P
600 = 3 P
P = 600 / 3 = 200
Put the value of P in demand equation
QD= 1000 – P
QD = 1000 – 200 = 800
Therefore the equilibrium price = ₹200 and the equilibrium quantity is = 800 units This change confirms to our expectations, i.e., rise in input prices raises prices and lowers supply.
3. qD= 1000 – P
qS= 700 + 2P
When ₹3 as tax is imposed on sale of salt the new demand and supply function will change
qD= 1000 – (P + 3)
qS= 700 + (2P +3)
In part A equilibrium price was ₹100 which goes up to ₹103 with imposition of tax
qD = 1000 – (100 + 3) = 1000 – 103 =897
qS = 700 + (2P + 3)
= 700 + 2(100 + 3)
= 700 + 2×103
= 700 + 206 = 906
qD < qS
Therefore, new price and quantity has to be adjusted.
Question 4.
The diagram below shows how the price of wheat is determined in a free market.
a. Show in a seperate diagram the changes on price and quantity demanded of wheat due to the following factors
- The price of fertilizers increases.
- The price of rice a substitute of wheat increases.
b. Assess the impact of an increased demand for wheat and an increase in its production.
Answer:
a. price and quantity demanded of wheat.
1. When the price of fertilizers increases the supply of wheat decreases. Its price increases and the quantity falls.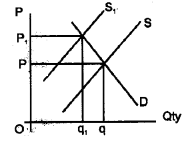
2. When the price of rice, a substitute of wheat increases people may switch to consume wheat, this will increase the demand for wheat. Its price will increase and quantity also will increase.
b. When the demand for heat increases its demand curve will shift rightward. When production increases its supply curve will shift rightward as shown in the diagram below.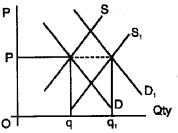
Due to these shifts, the quantity will increase anyhow. But the effect on the price will be in different forms. The price may fall, will be constant or even may increase. Whether the price will increase, decrease or remain constant is determined by the respective shifts in demand and supply.
If both demand and supply shift in the same magnitude the price will be same. If the shift in the demand is more than the supply the price will increase. And if the shift in the supply is more than the shift in the demand the price will fall.
Plus Two Economics All Chapters Question and Answers
- Plus Two Computer Application Chapter Wise Question and Answers PDF
- Plus Two Computer Application Notes Chapter 1 An Overview of C++ Chapter Wise Question and Answers PDF
- Plus Two Computer Application Notes Chapter 2 Arrays Chapter Wise Question and Answers PDF
- Plus Two Computer Application Notes Chapter 3 Functions Chapter Wise Question and Answers PDF
- Plus Two Computer Application Notes Chapter 4 Web Technology Chapter Wise Question and Answers PDF
- Plus Two Computer Application Notes Chapter 5 Web Designing using HTML Chapter Wise Question and Answers PDF
- Plus Two Computer Application Notes Chapter 6 Client Side Script using Javascript Chapter Wise Question and Answers PDF
- Plus Two Computer Application Notes Chapter 7 Web Hosting Chapter Wise Question and Answers PDF
- Plus Two Computer Application Notes Chapter 8 Database Management System Chapter Wise Question and Answers PDF
- Plus Two Computer Application Notes Chapter 9 Structured Query Language-SQL Chapter Wise Question and Answers PDF
- Plus Two Computer Application Notes Chapter 10 Enterprise Resource Planning-ERP Chapter Wise Question and Answers PDF
- Plus Two Computer Application Notes Chapter 11 Trends and Issues in ICT Chapter Wise Question and Answers PDF
Benefits of the Plus Two Economics Chapter 5 Market Equilibrium Question and Answers PDF
The Plus Two Economics Chapter 5 Market Equilibrium Question and Answers PDF that has been provided above is extremely helpful for all students because of the way it has been drafted. It is designed by teachers who have over 10 years of experience in the field of education. These teachers use the help of all the past years’ question papers to create the perfect Plus Two Economics Chapter 5 Market Equilibrium Question and Answers PDF.
0 comments:
Post a Comment